Definitions:
Frequency: The number of times a value of the data occurs. Relative Frequency: The ratio of the number of times a value of the data occurs in the set of all outcomes to the number of all outcomes Histogram: A graphical representation in x – y form of the distribution of data in a data set; x represents the data and y represents the frequency, or relative frequency. The graph consists of contiguous rectangles. Class: categories which data is grouped. Interval: a range of data and is used when displaying large data sets.ALEKS Topics:
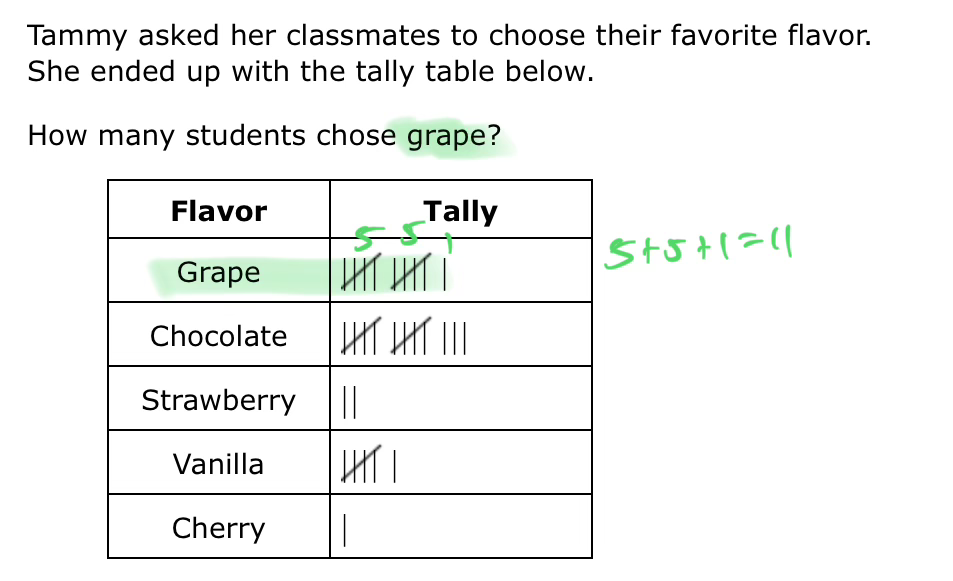
Topic 1: Interpreting a line graph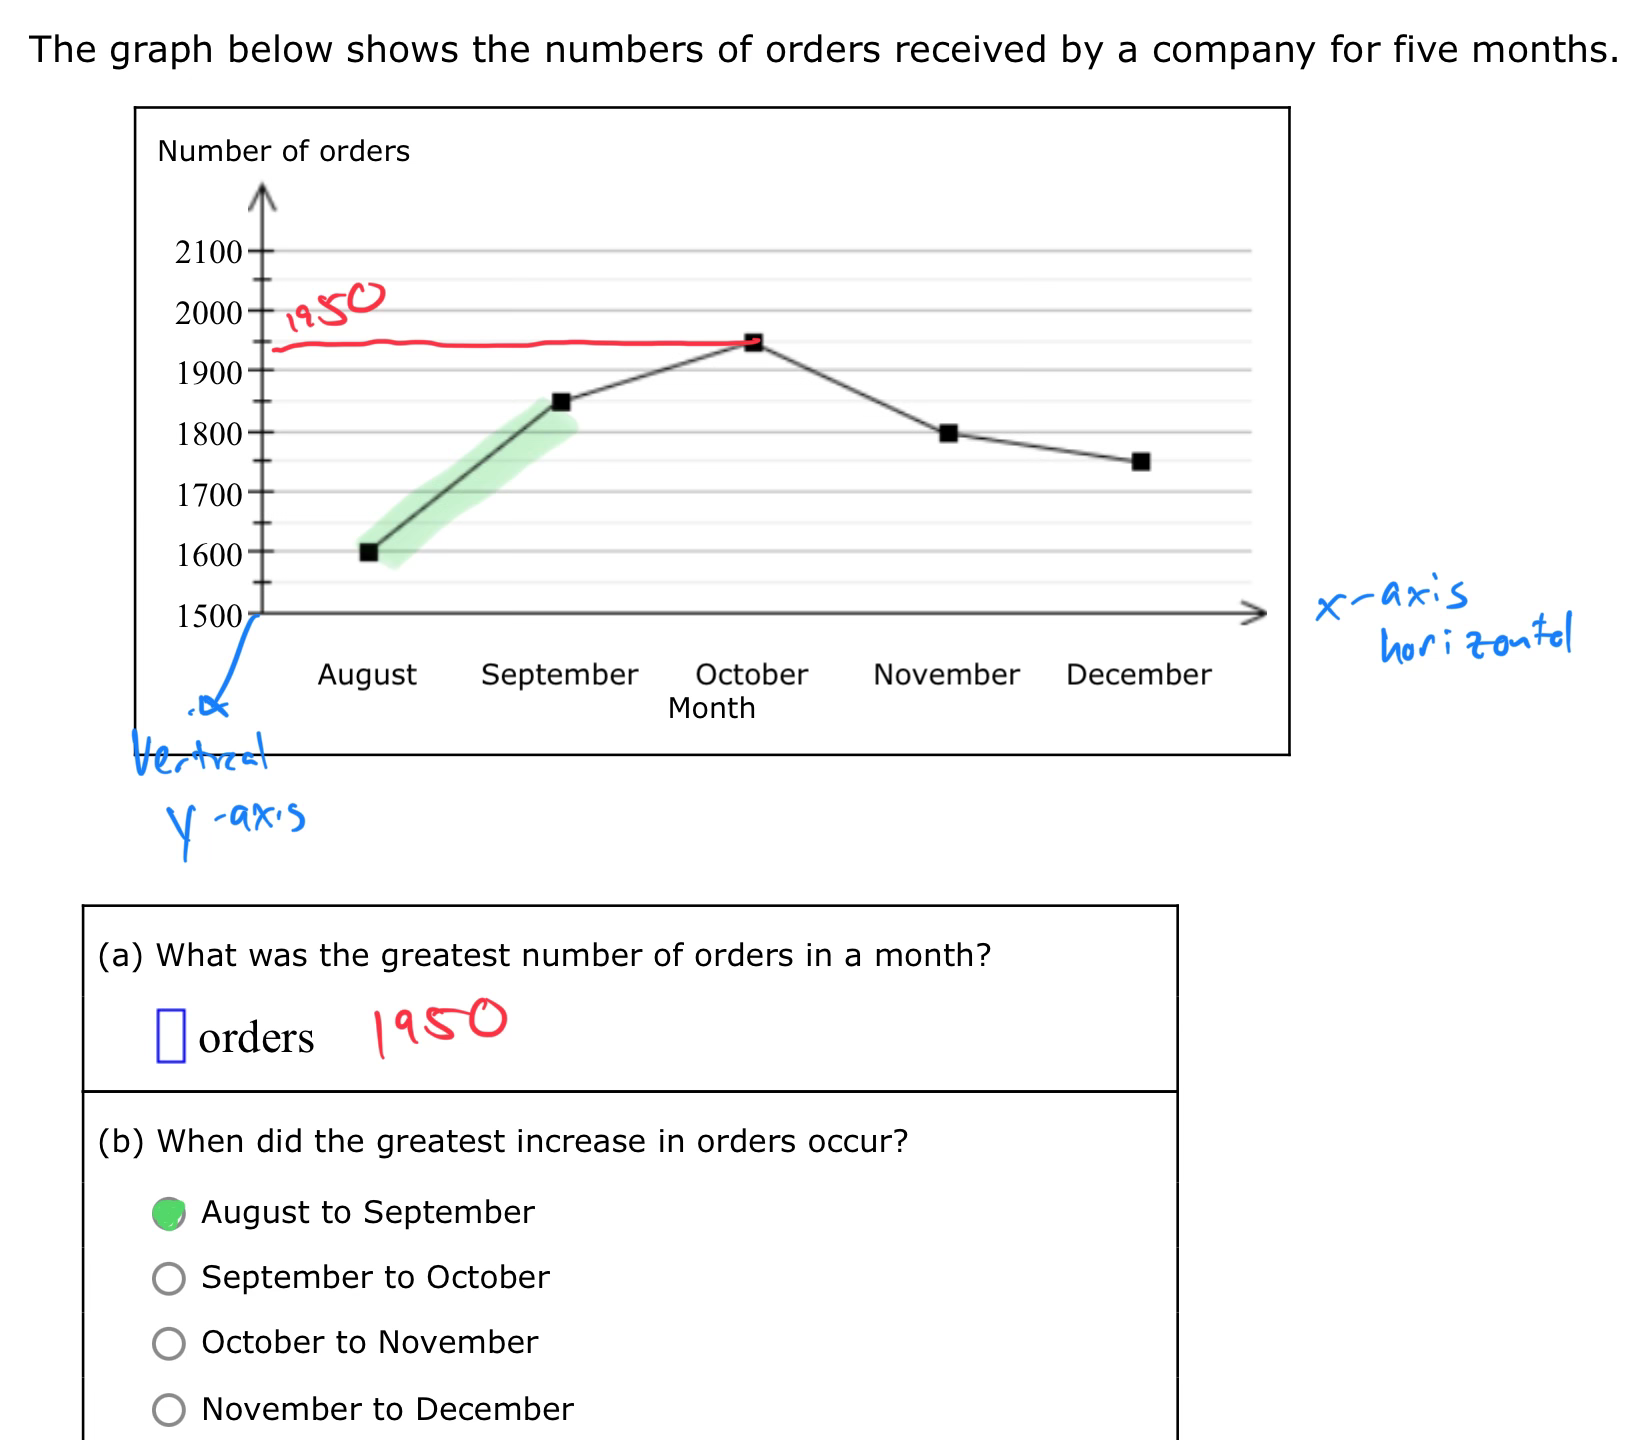 Topic 2: Interpreting a tally table
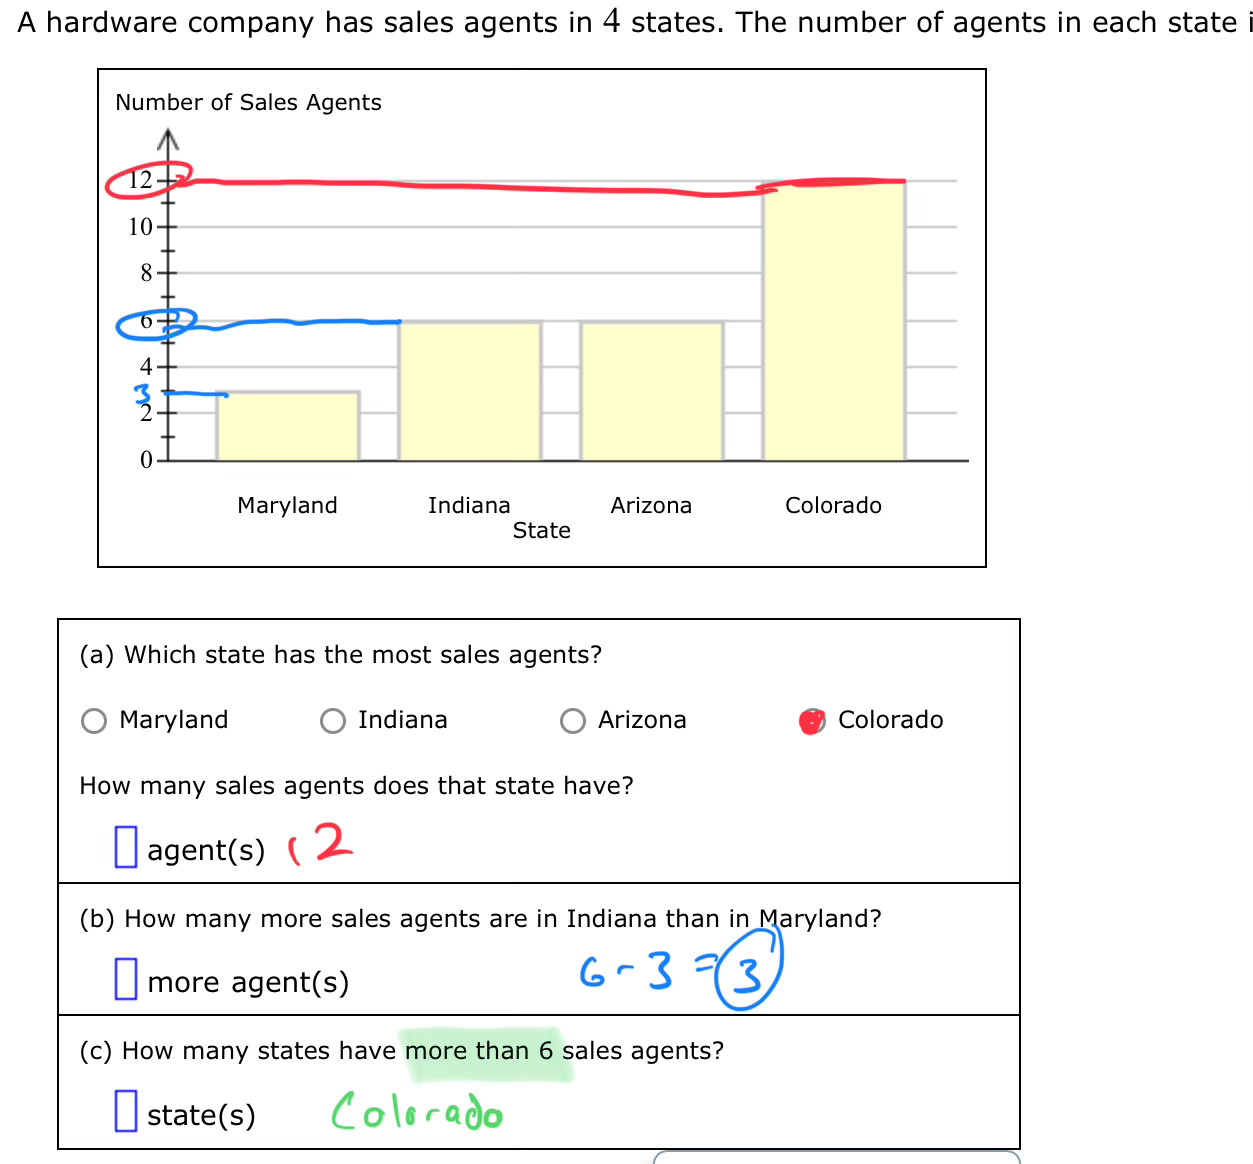
 Topic 3: Interpreting a bar graph
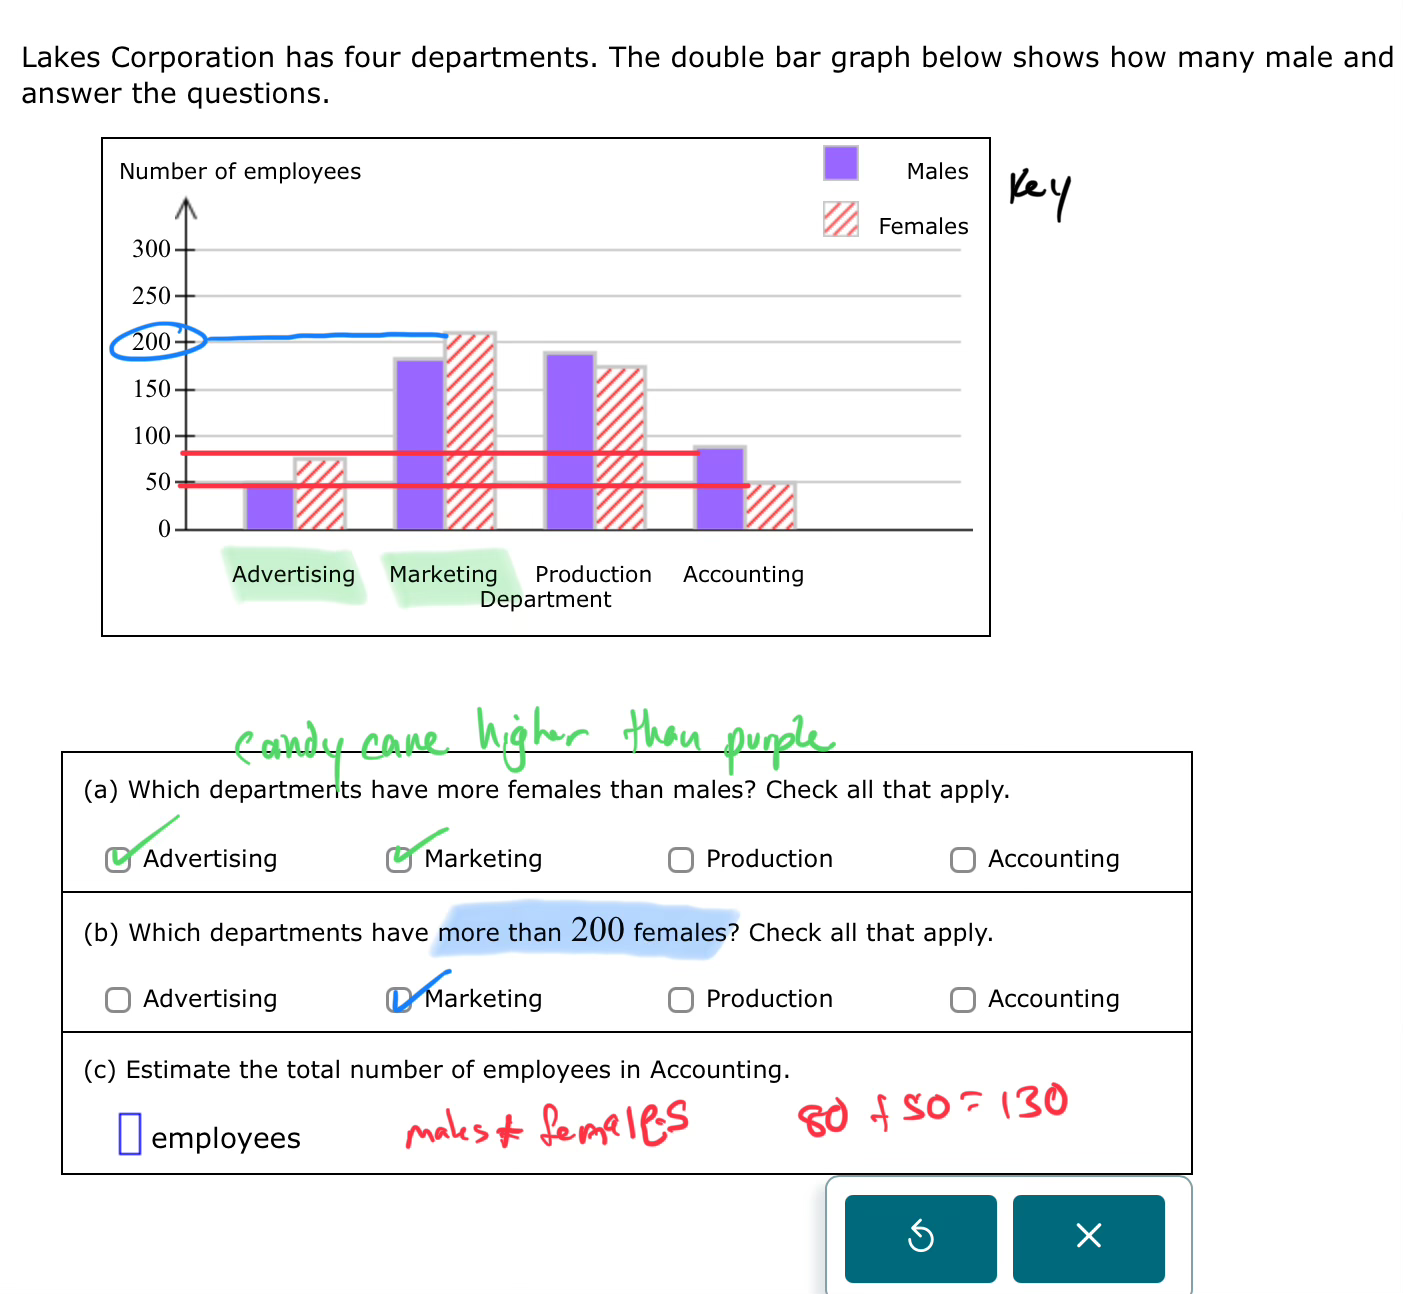
 Topic 4: Interpreting a double bar graph
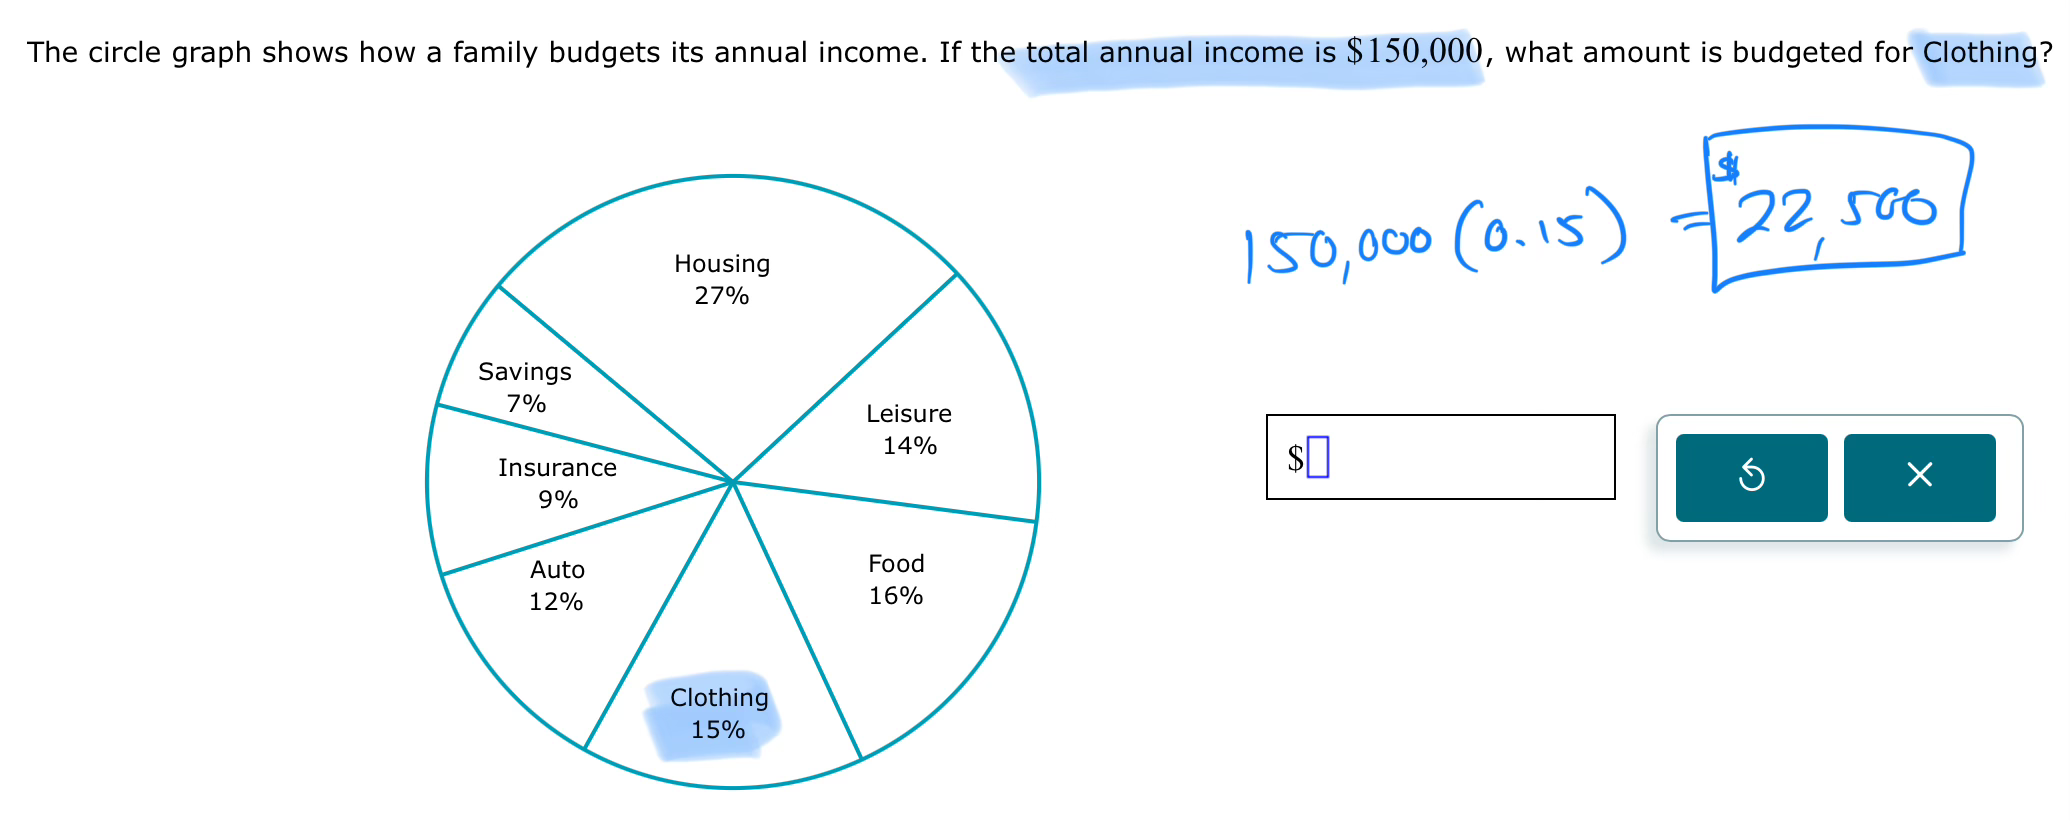
 Topic 5: Finding a percentage of a total amount in a circle graph
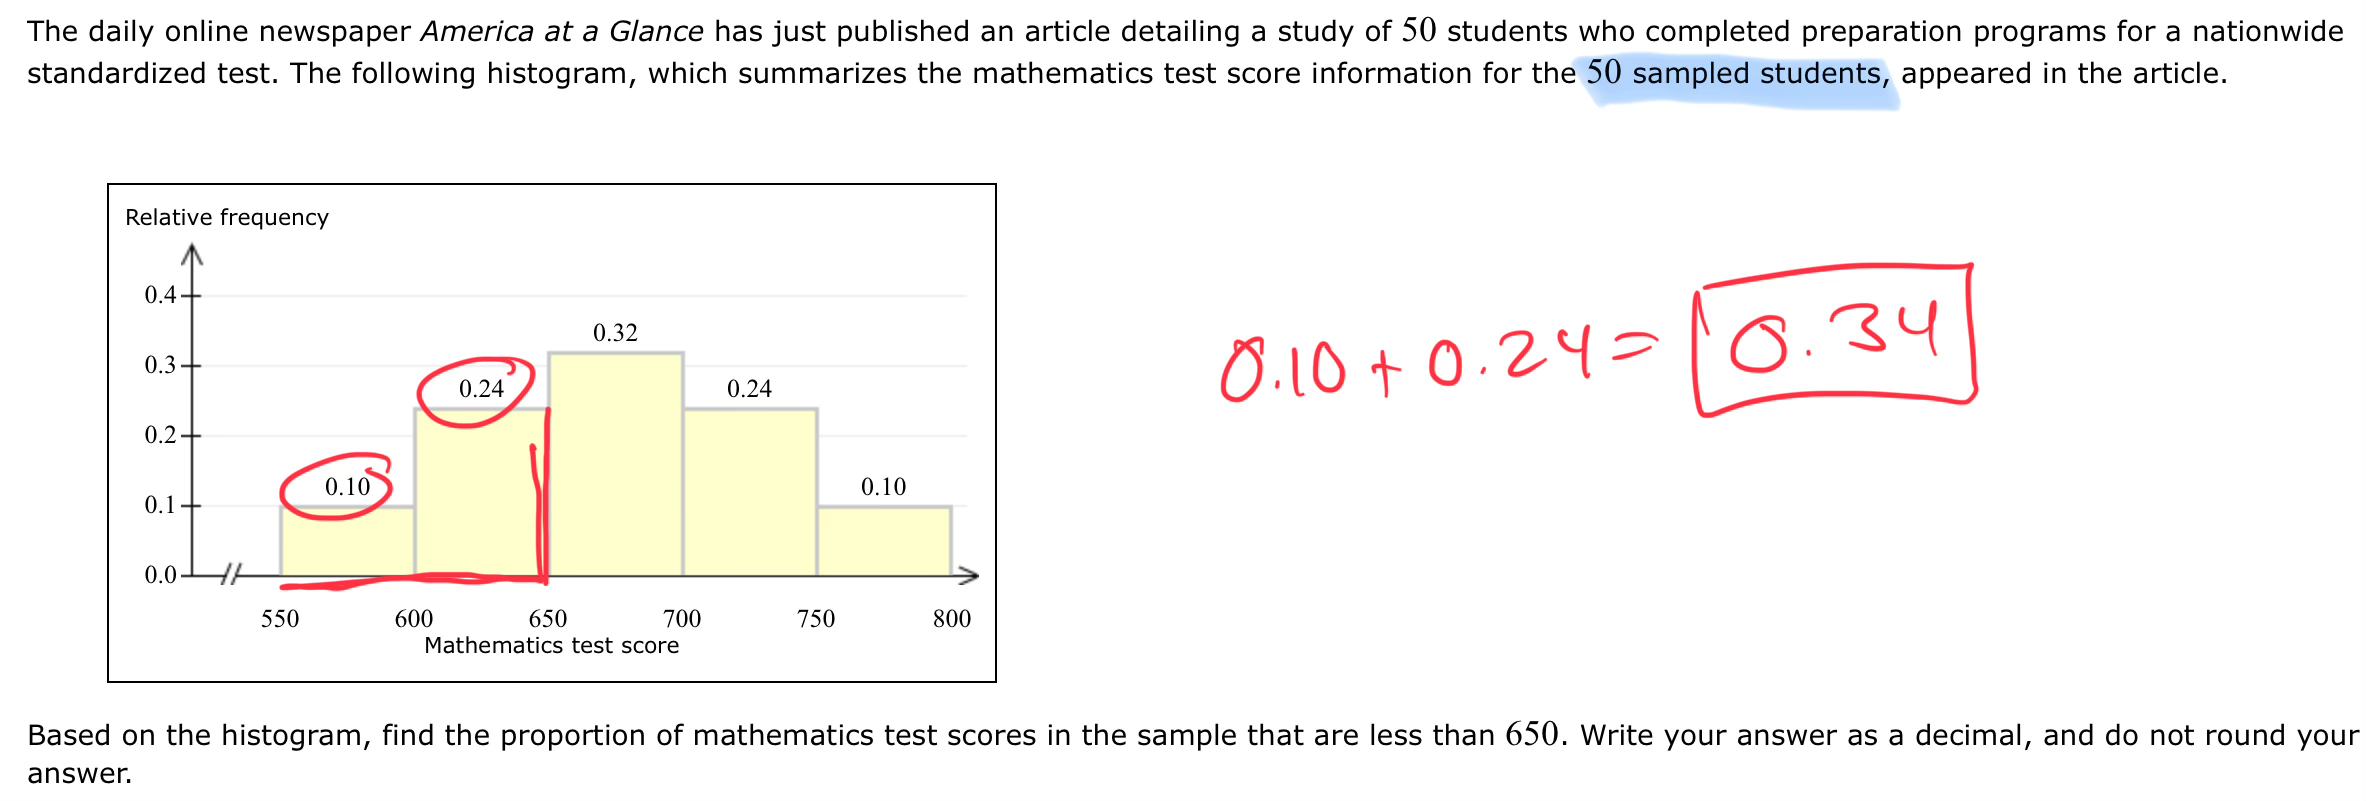
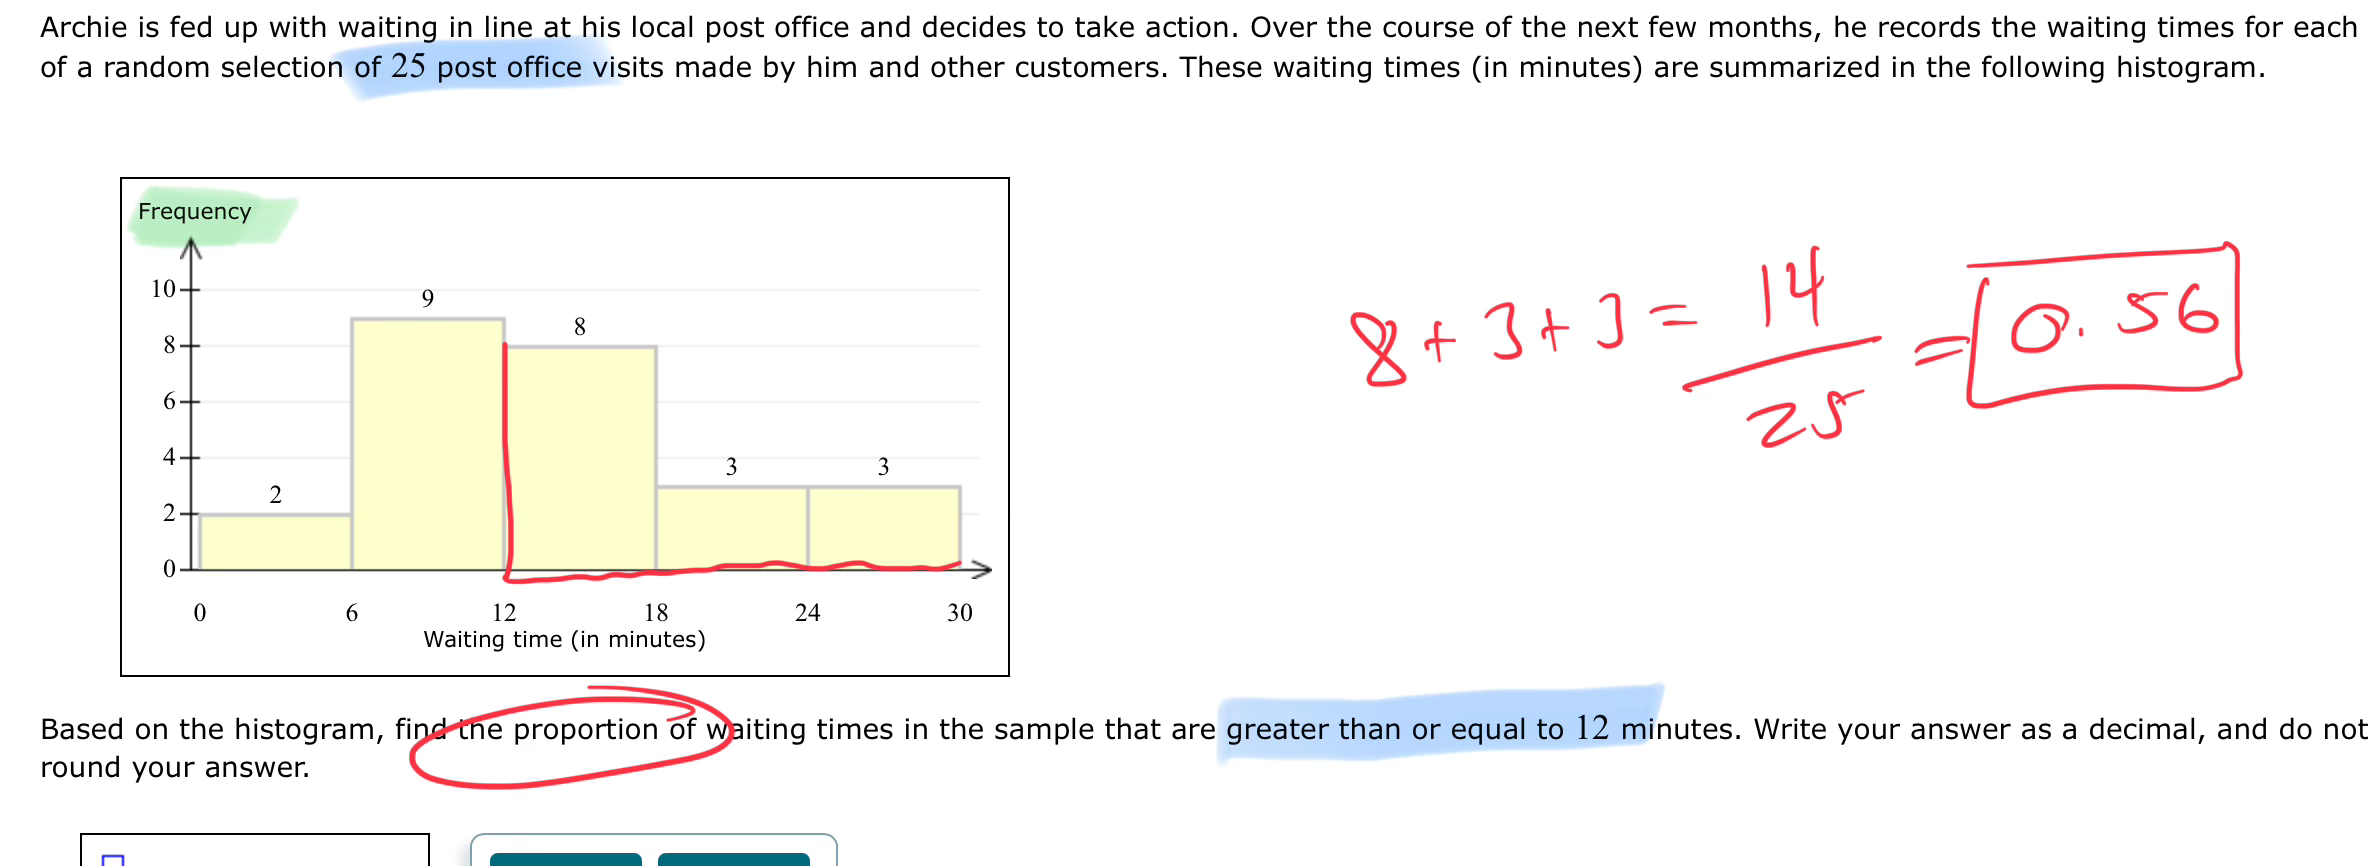
 Topic 6: Interpreting relative frequency histograms
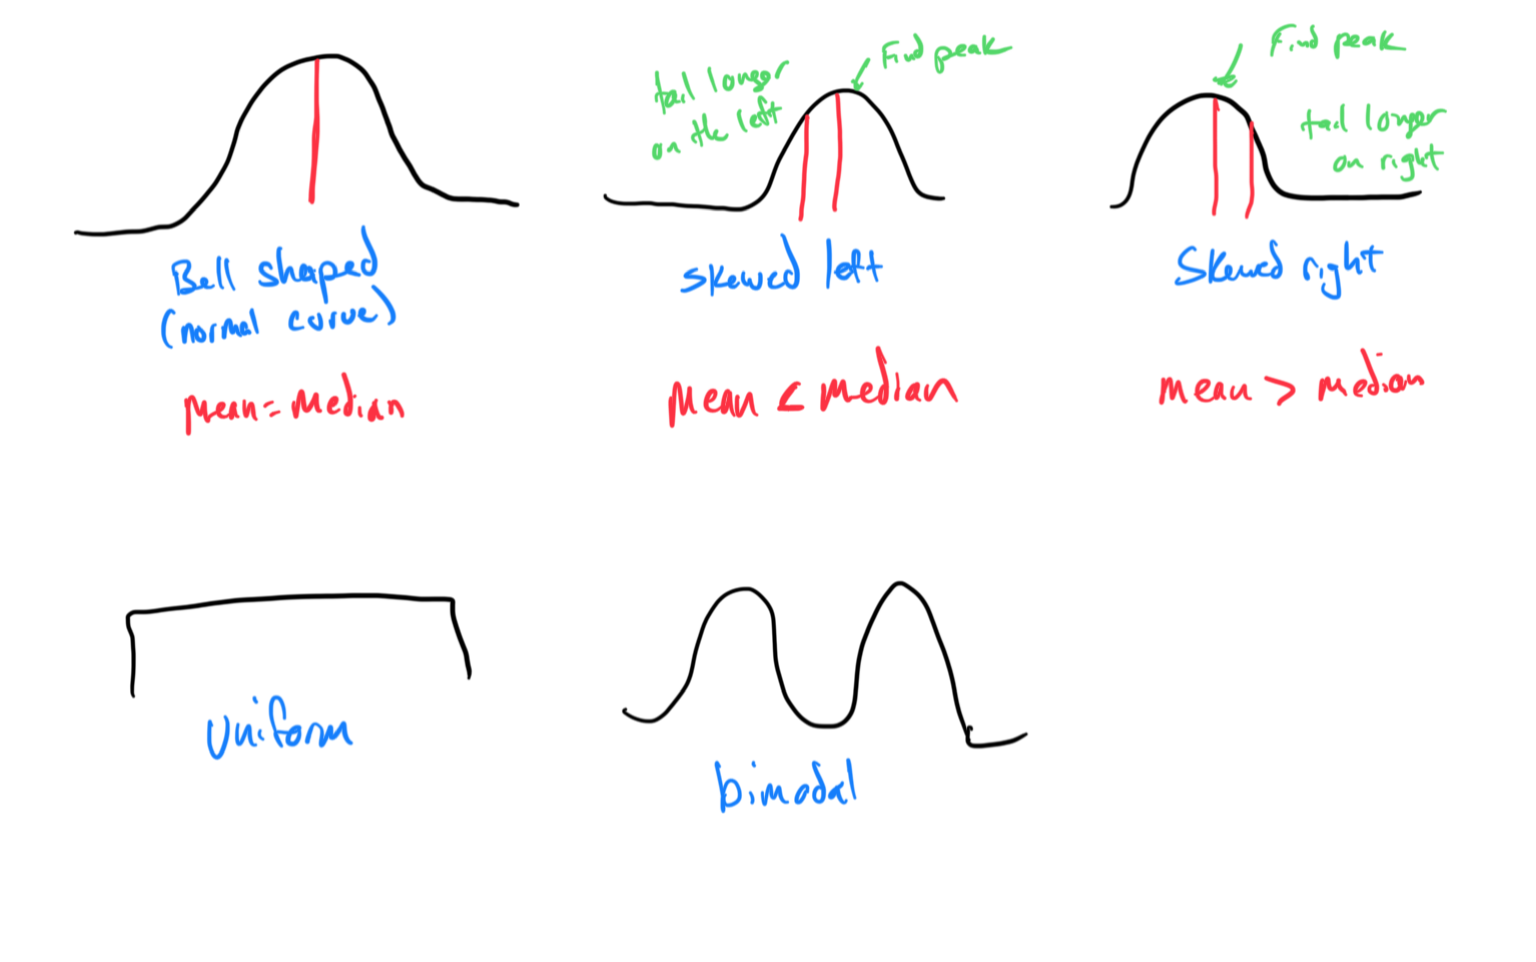
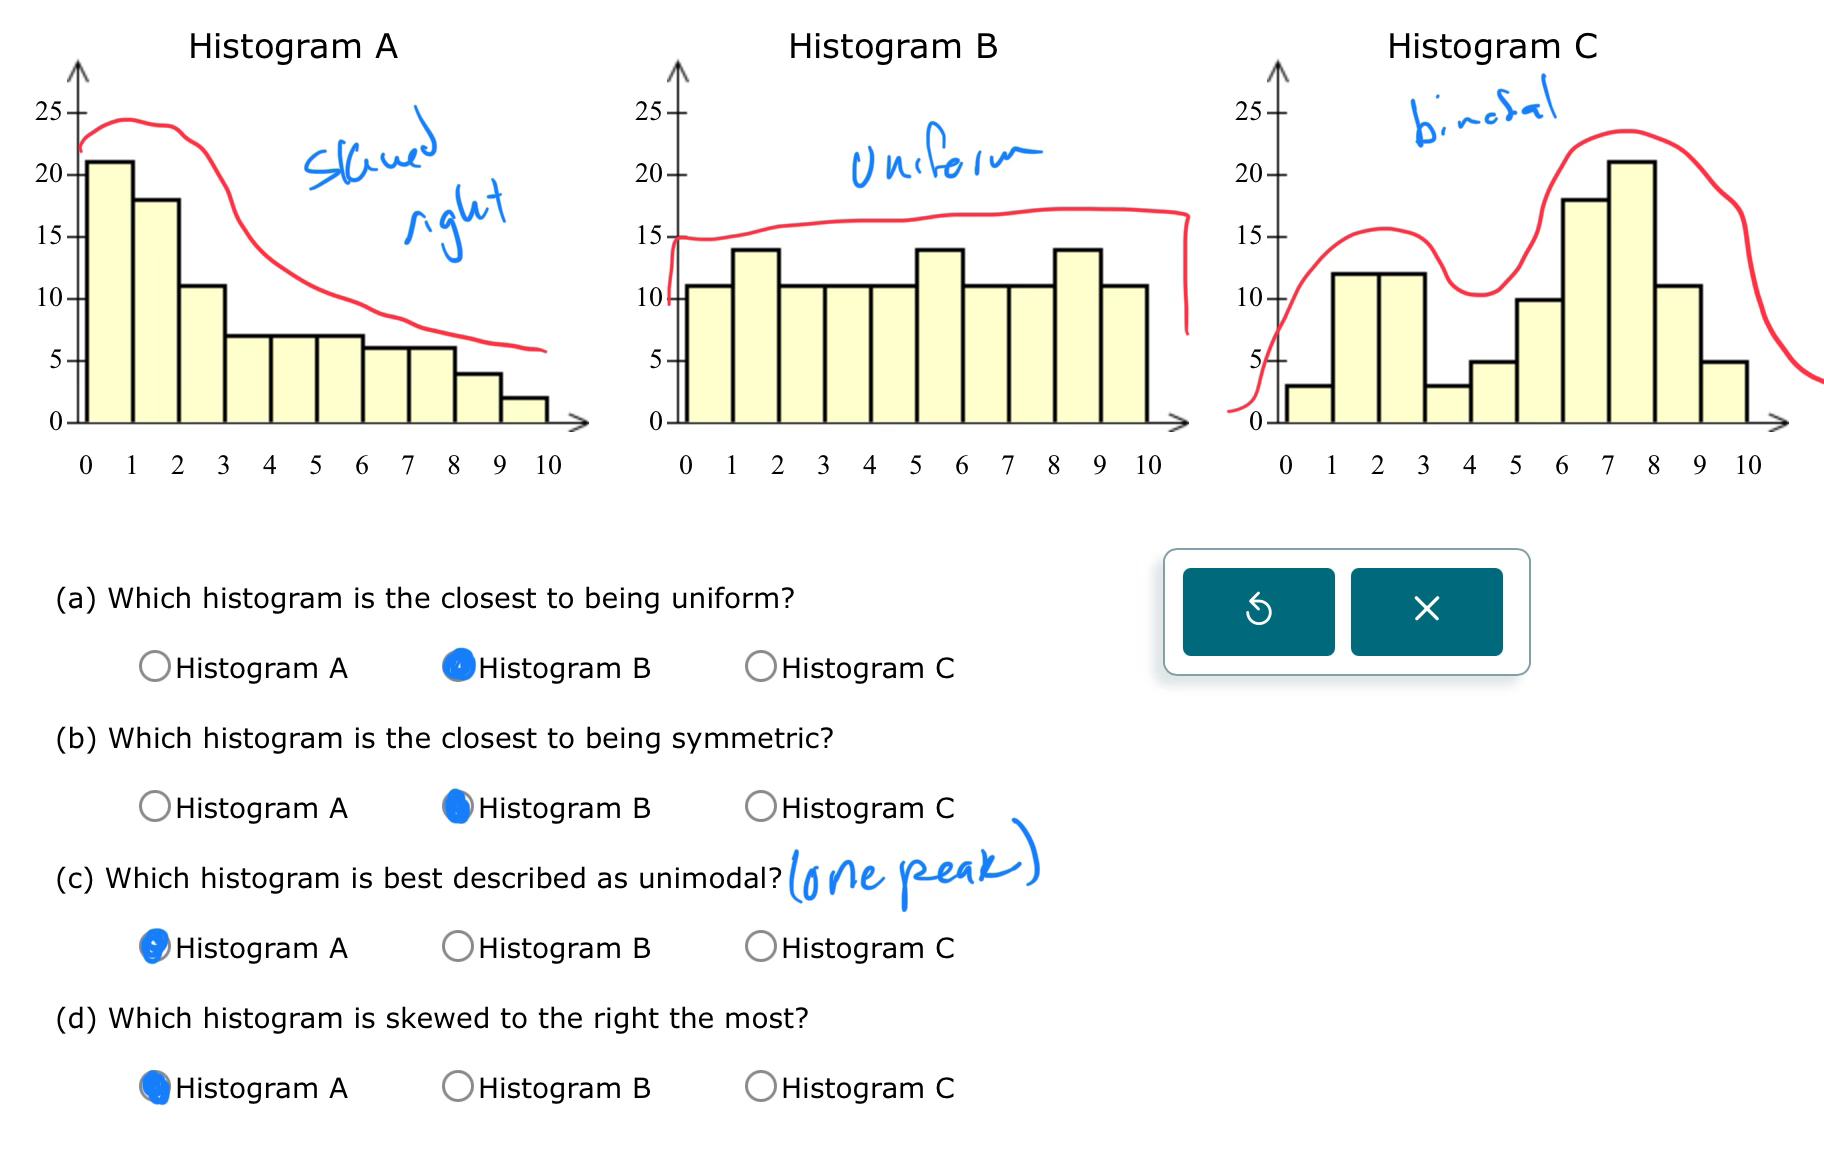
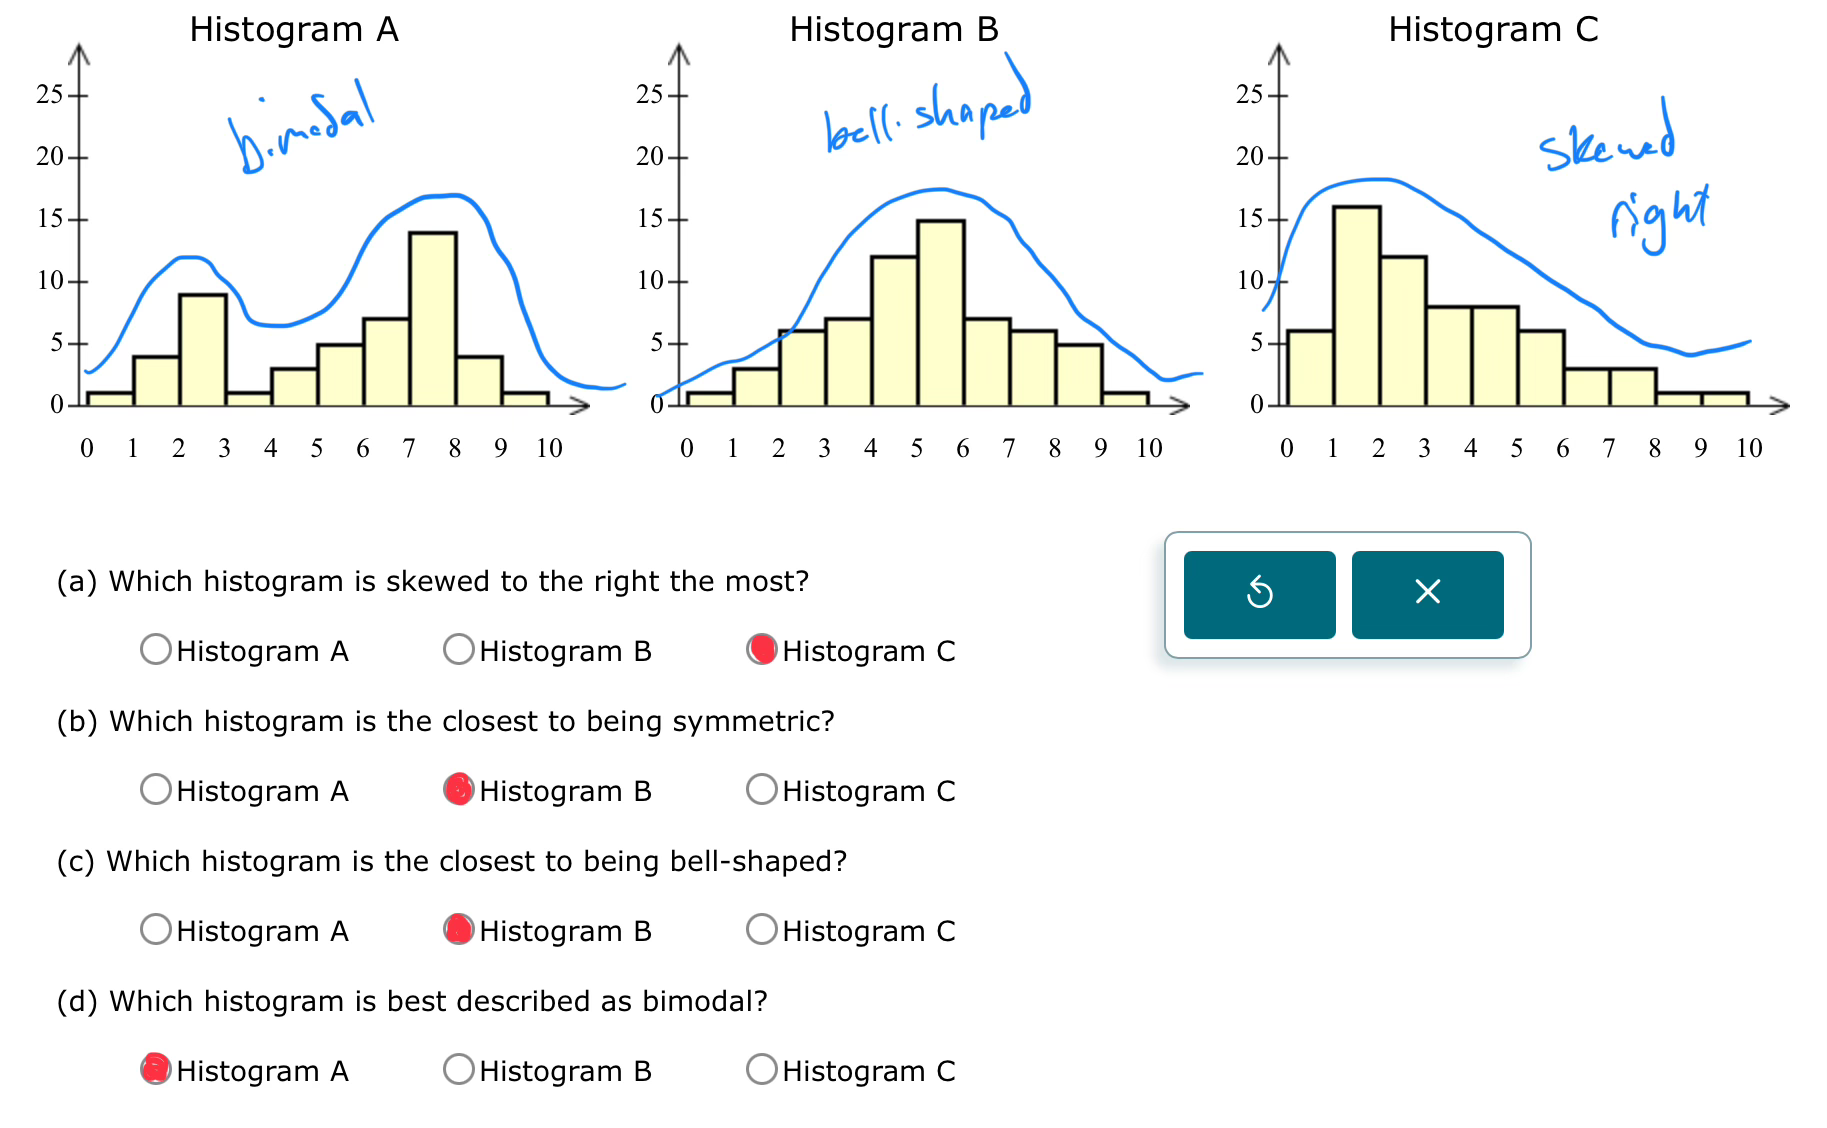
 Topic 7: Shapes of discrete distributions
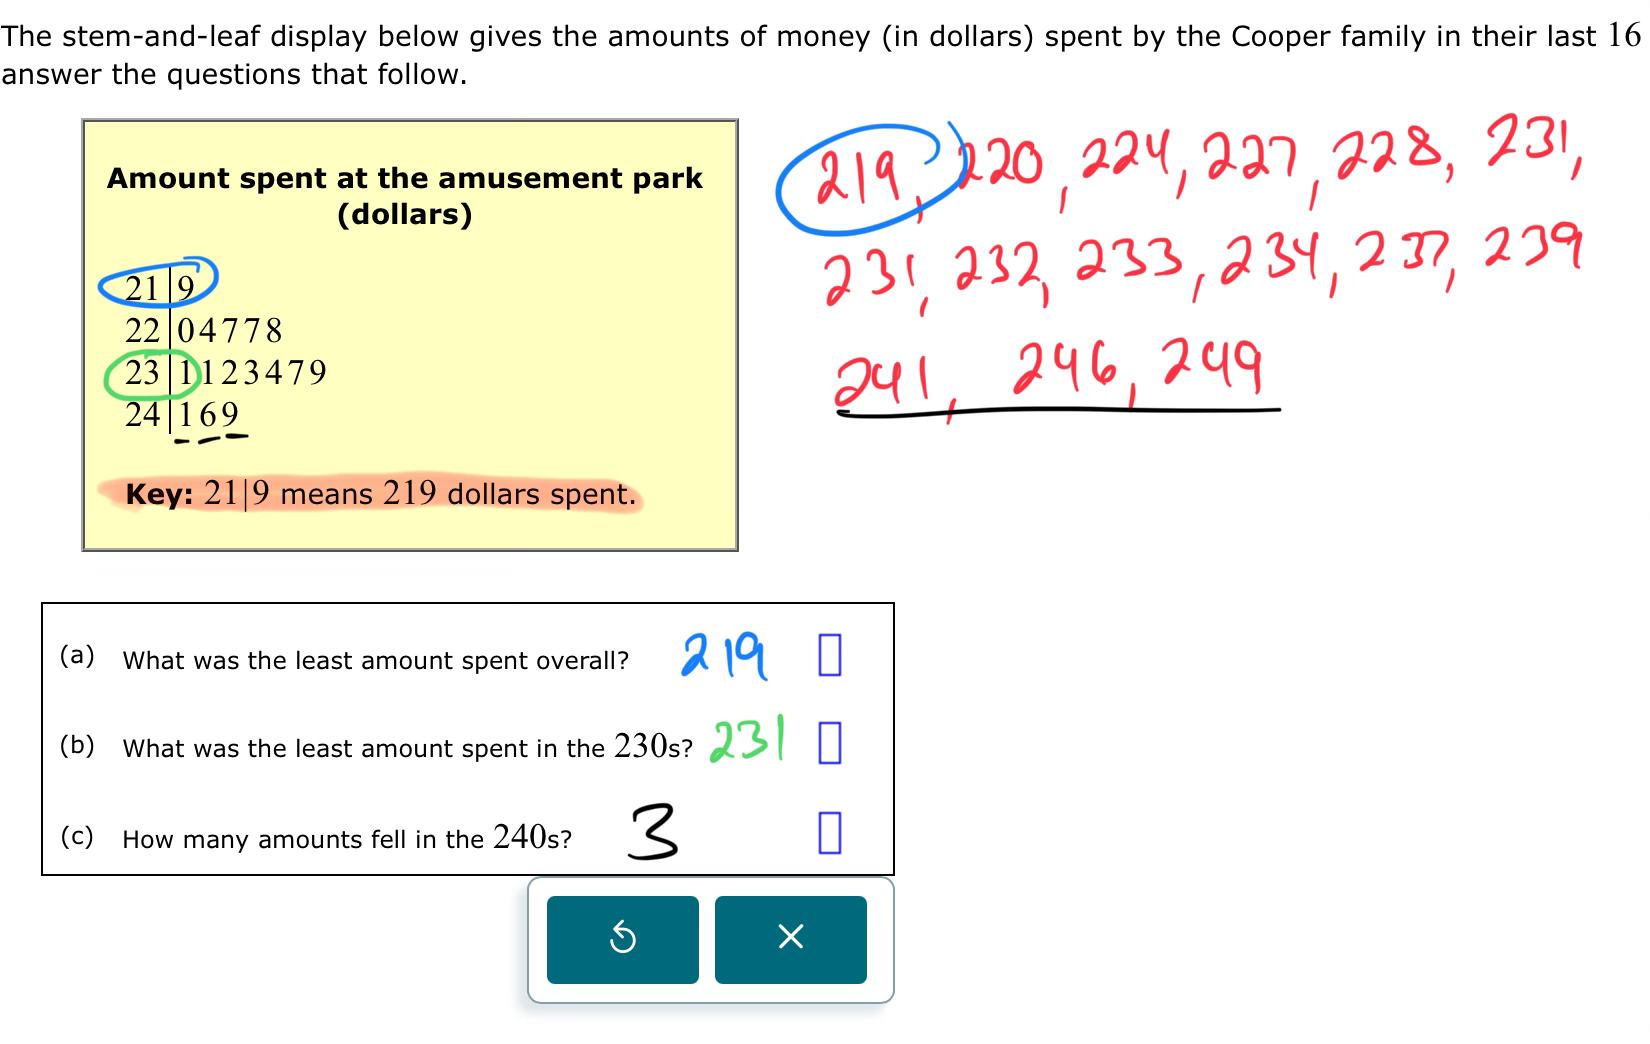
 Topic 8: Interpreting a stem-and-leaf display
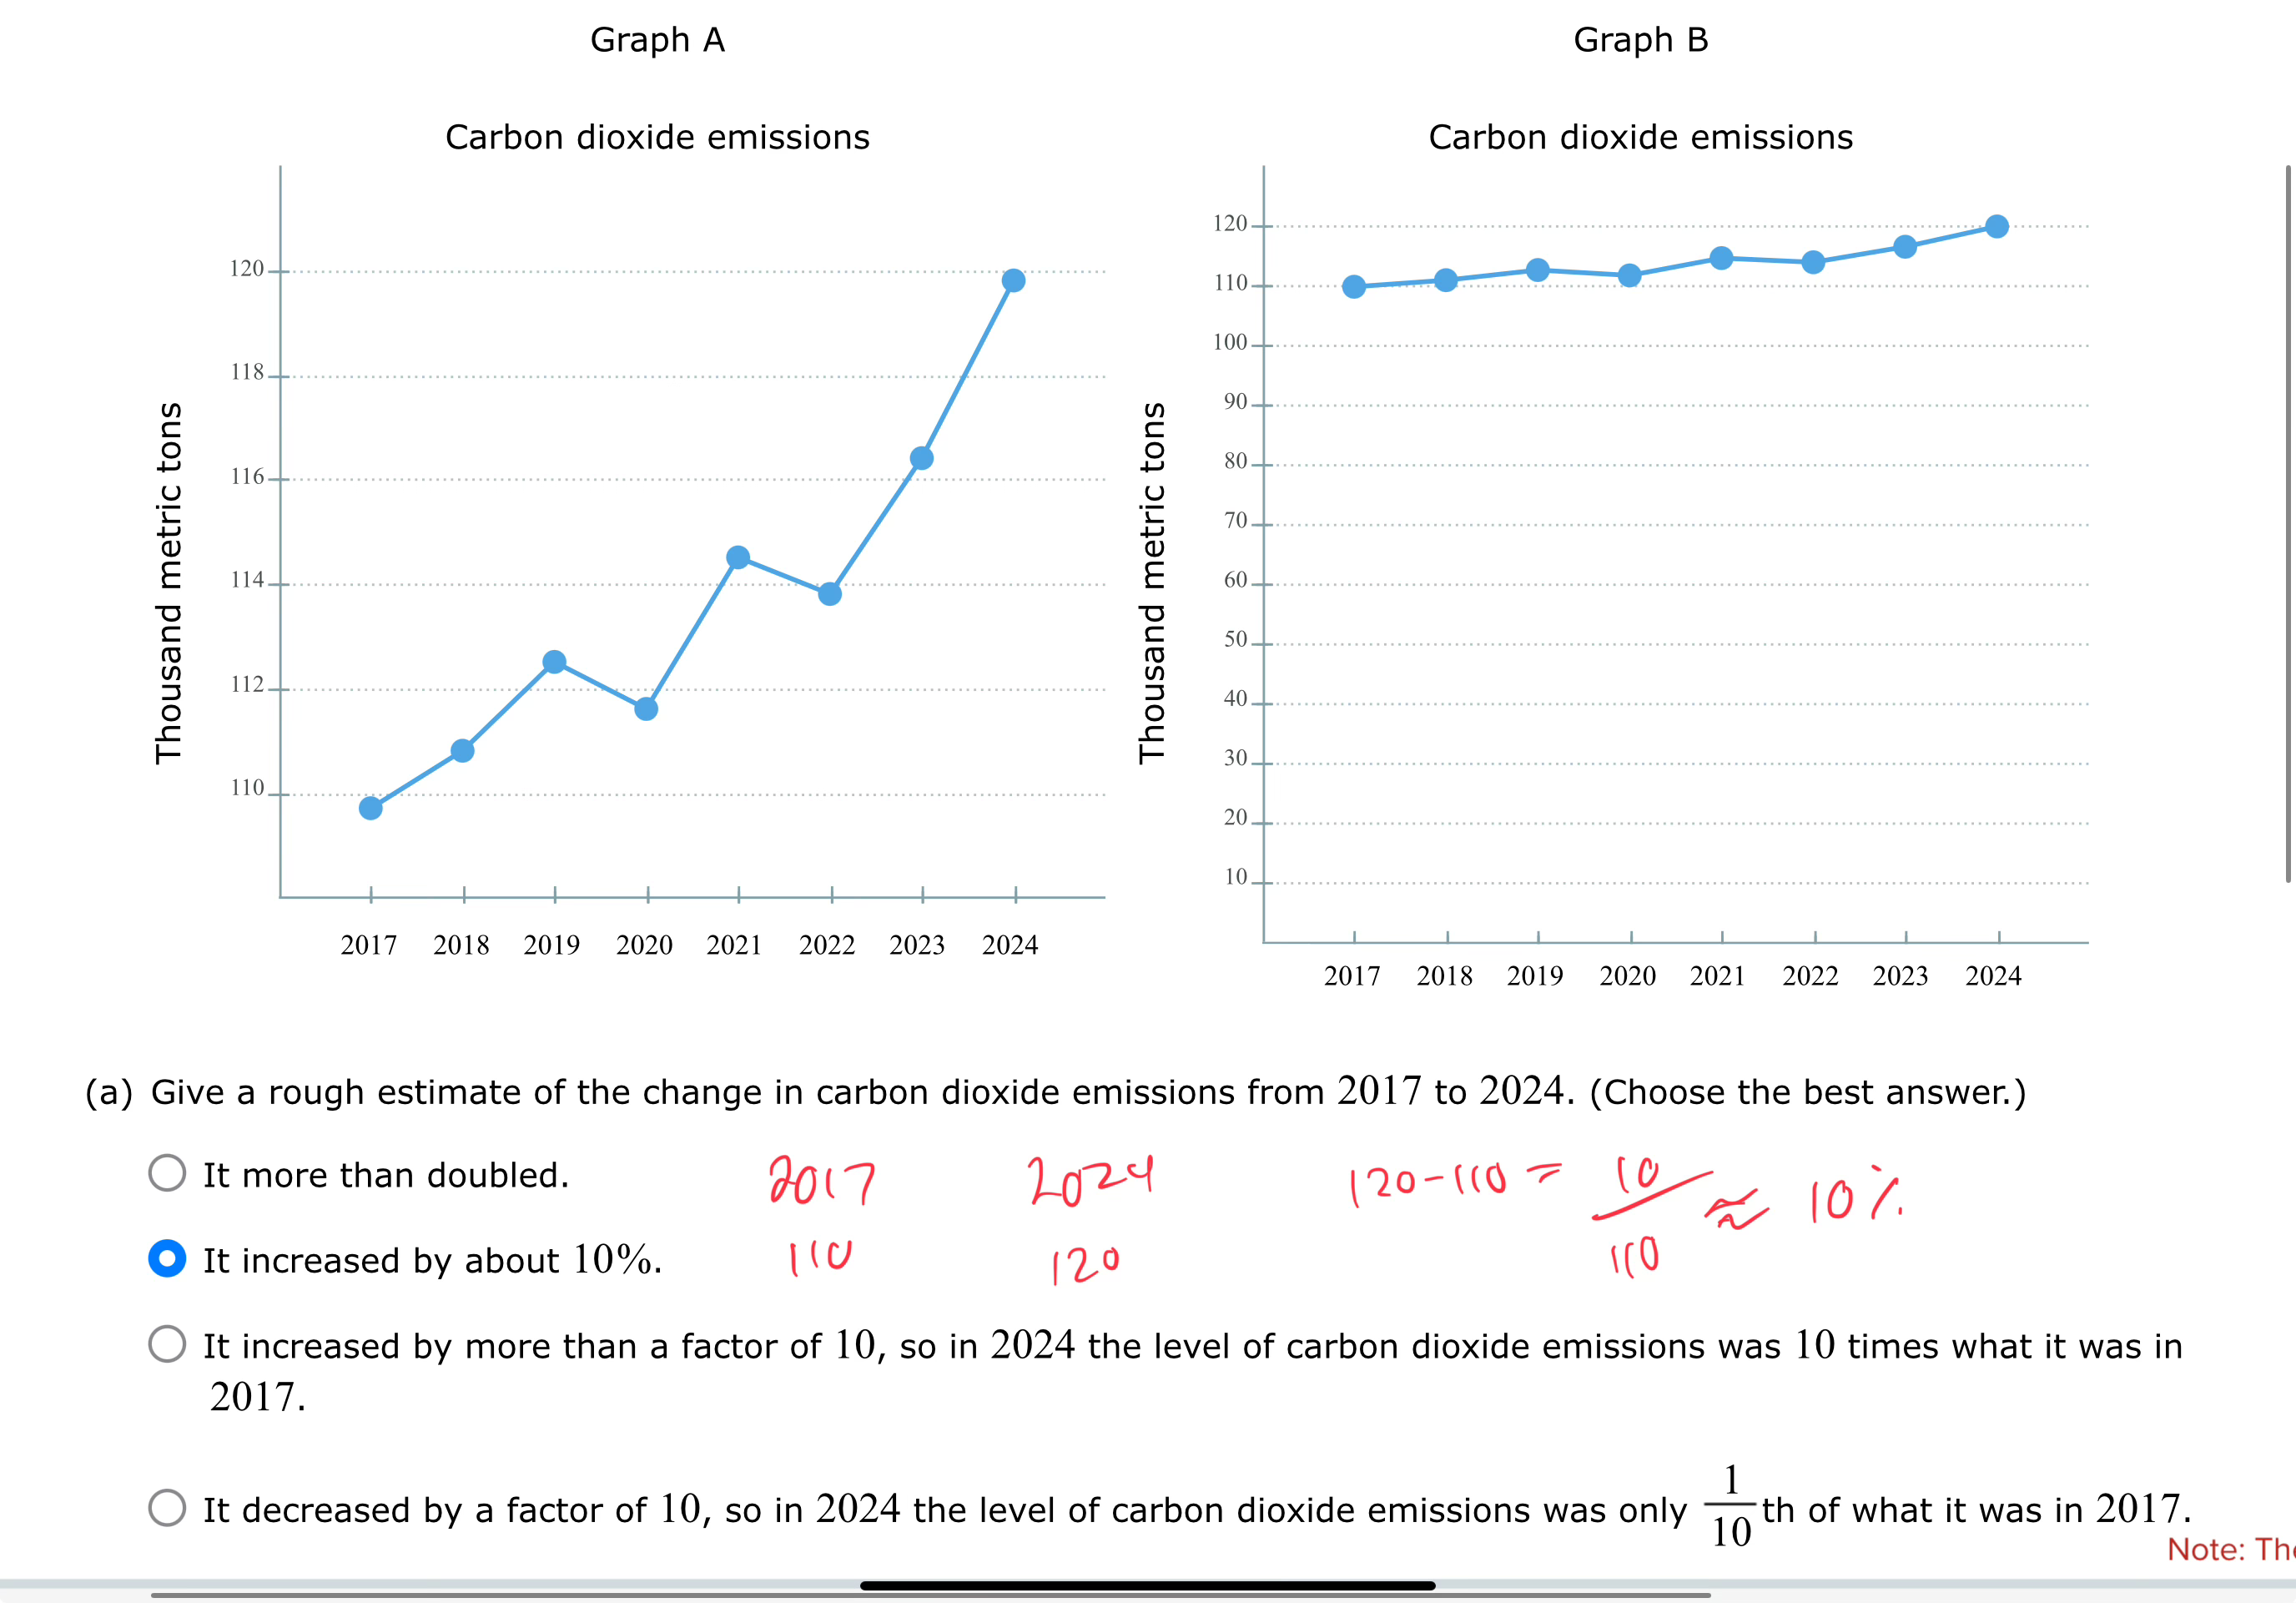
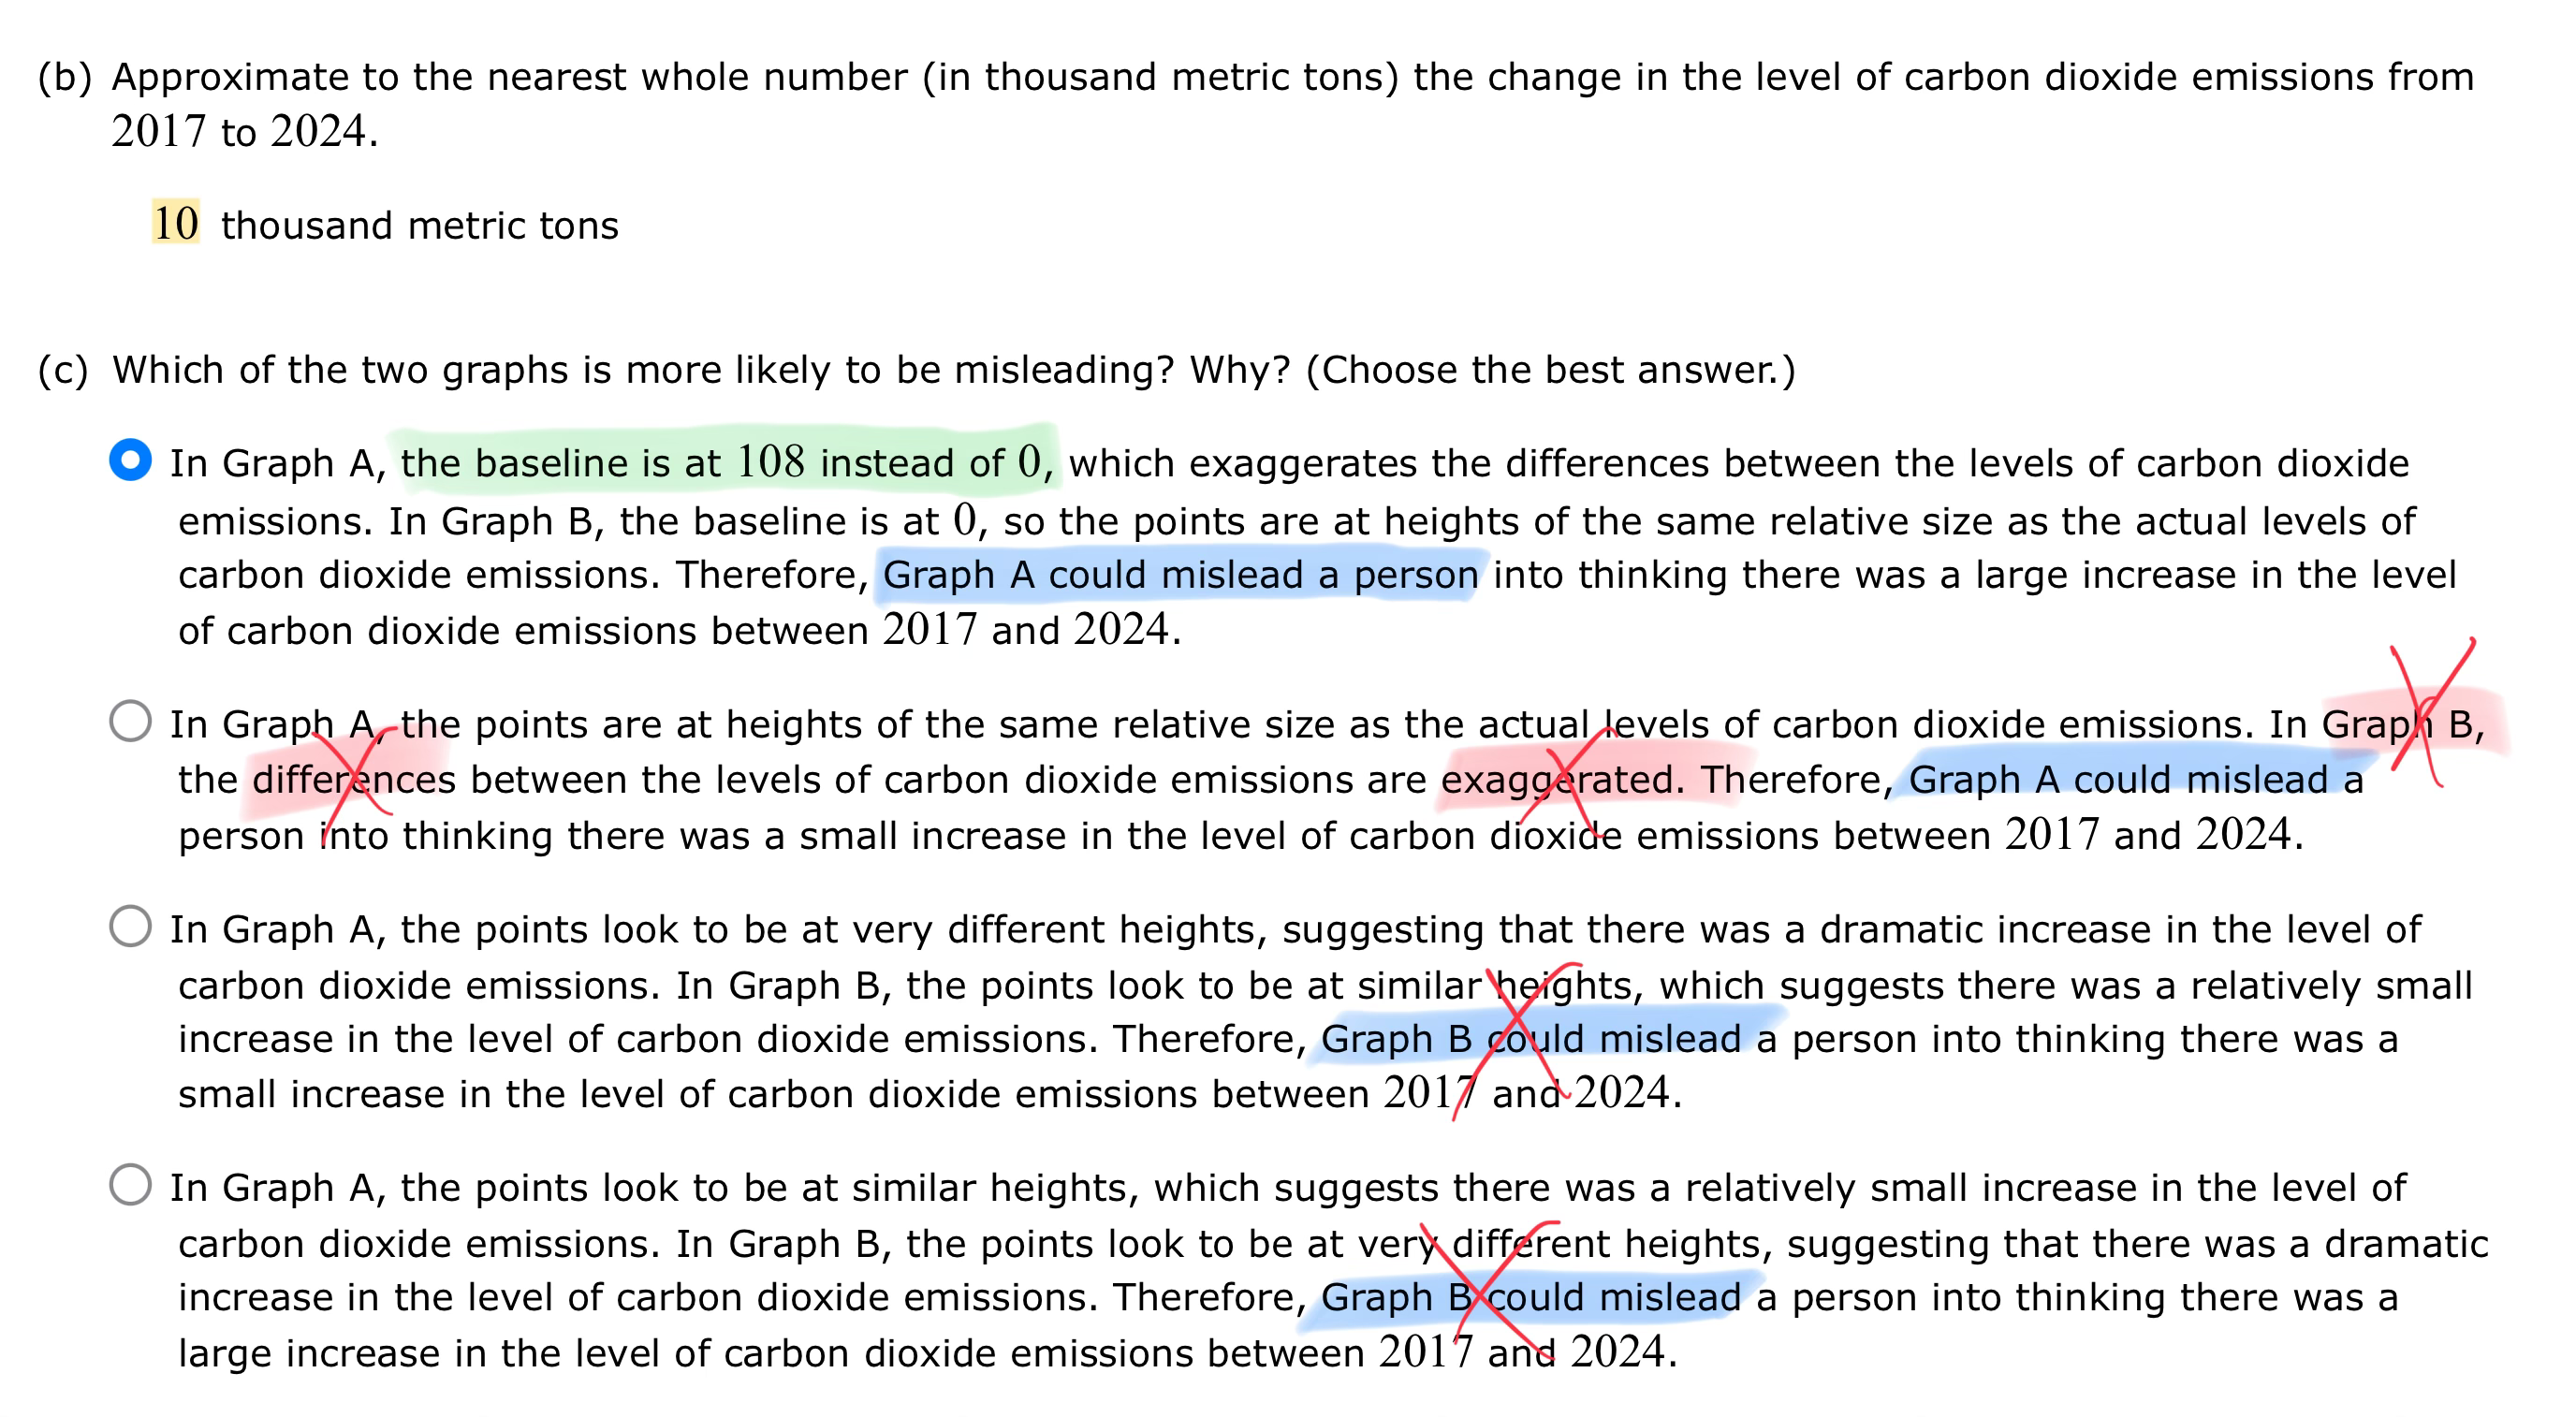
 Topic 9: Understanding how adjusting the vertical scale can make a graph misleading
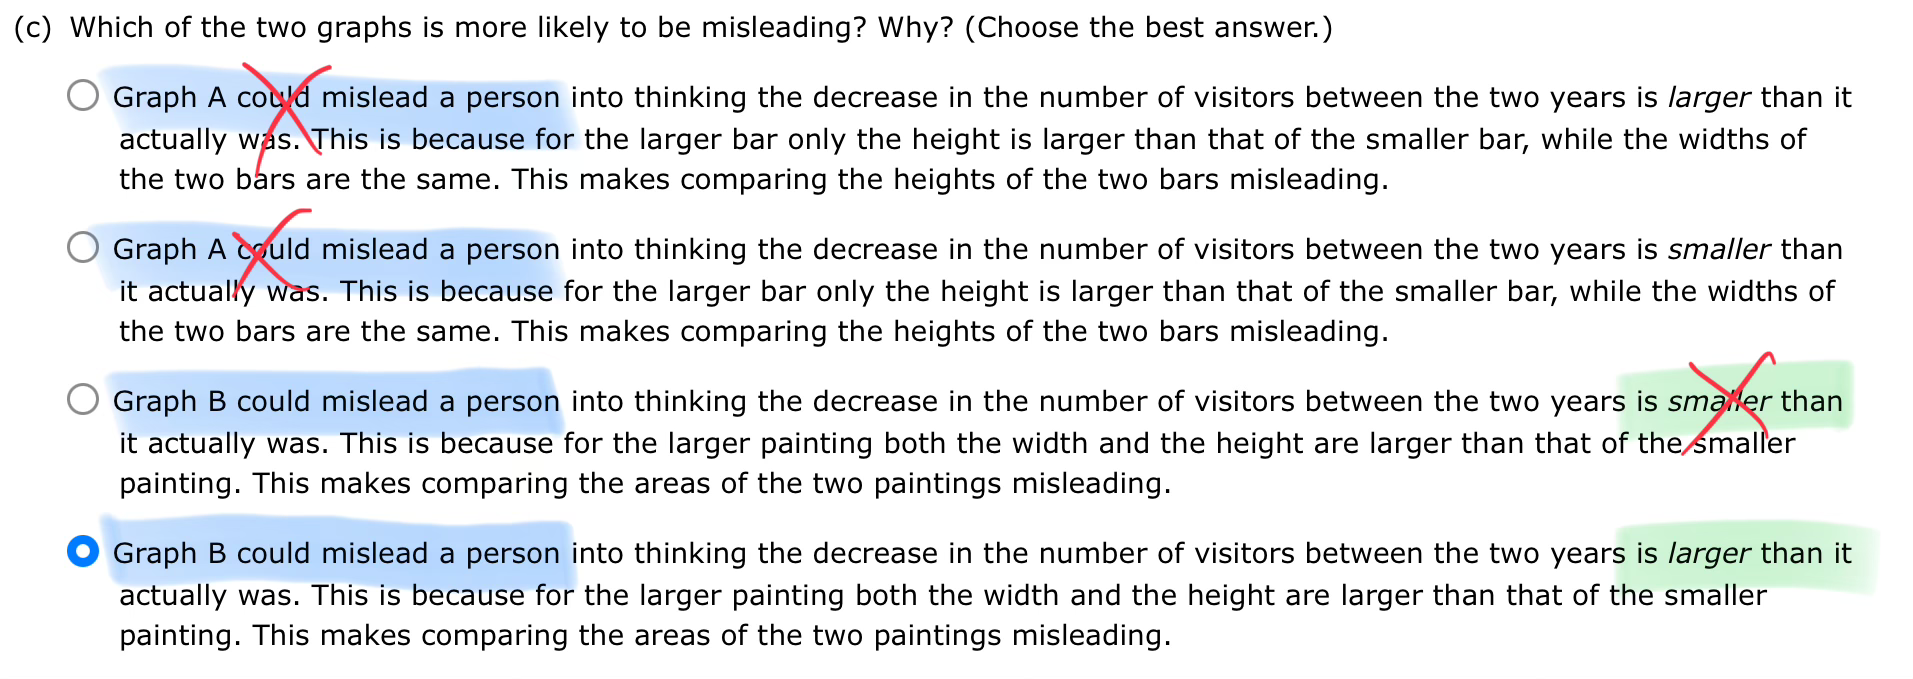
 Topic 10: Understanding how two dimensional graphs can be misleading
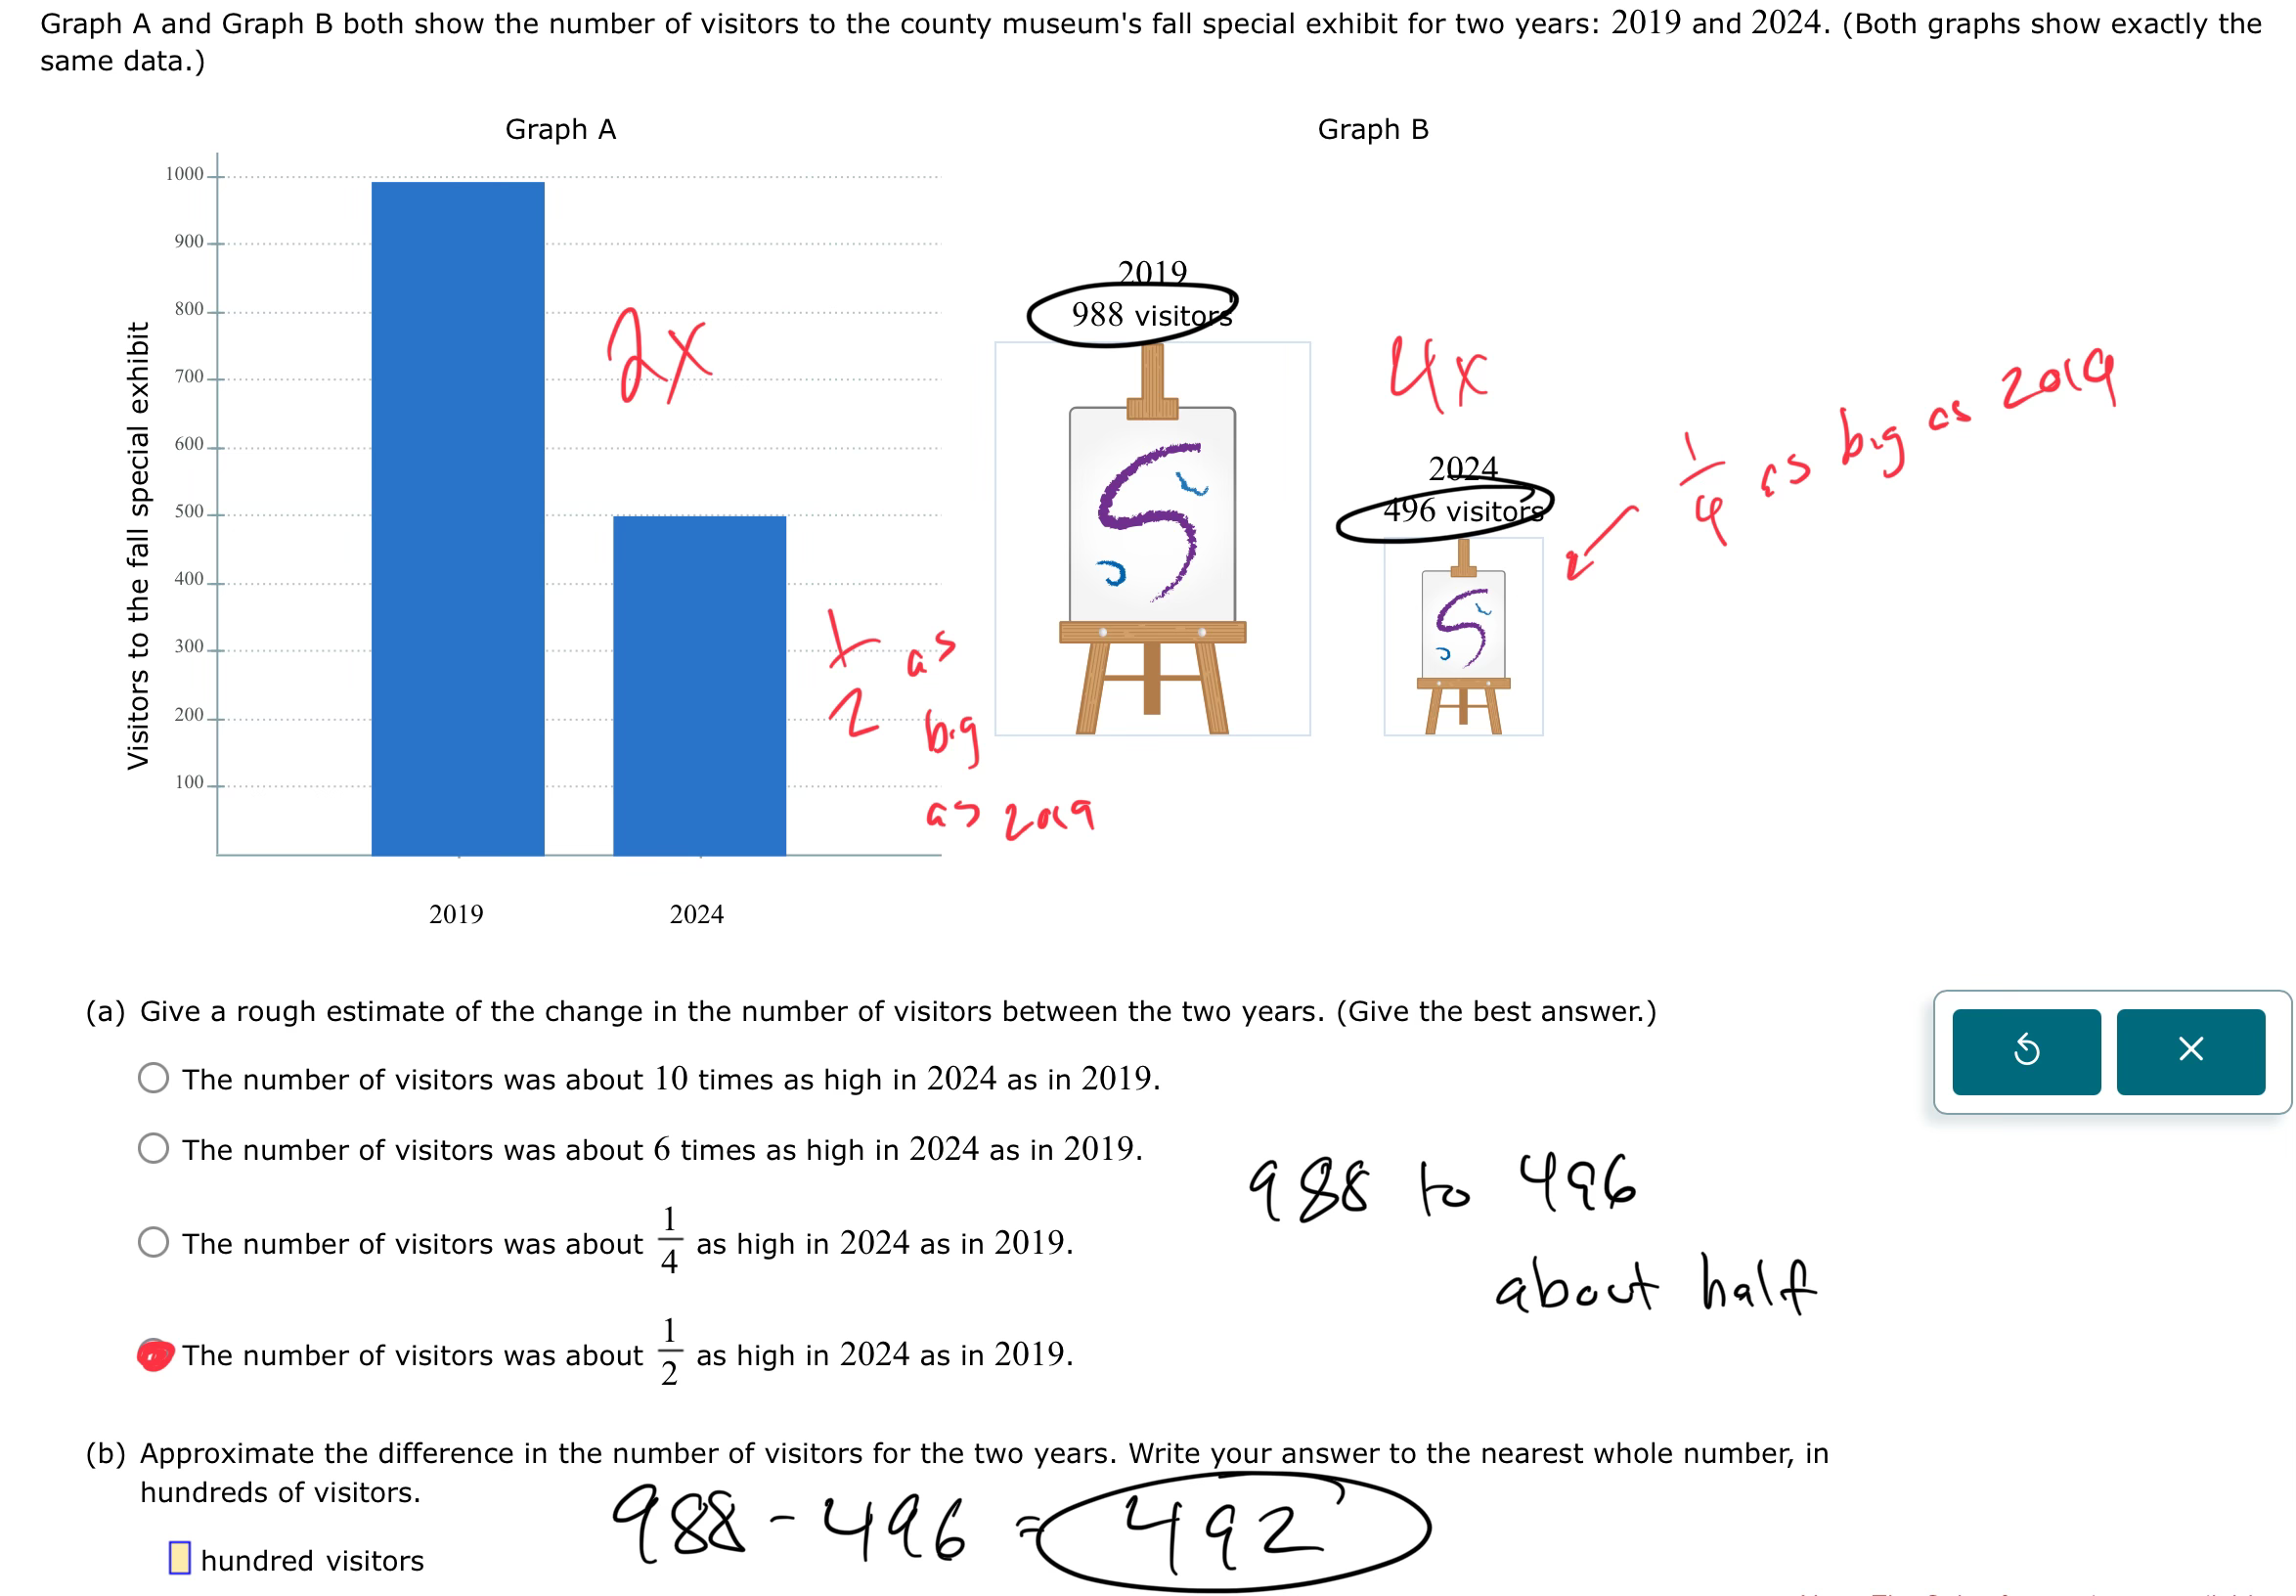 The answer is 5.
Because it says “hundred visitors”. “5 hundred visitors”
The answer is 5.
Because it says “hundred visitors”. “5 hundred visitors”
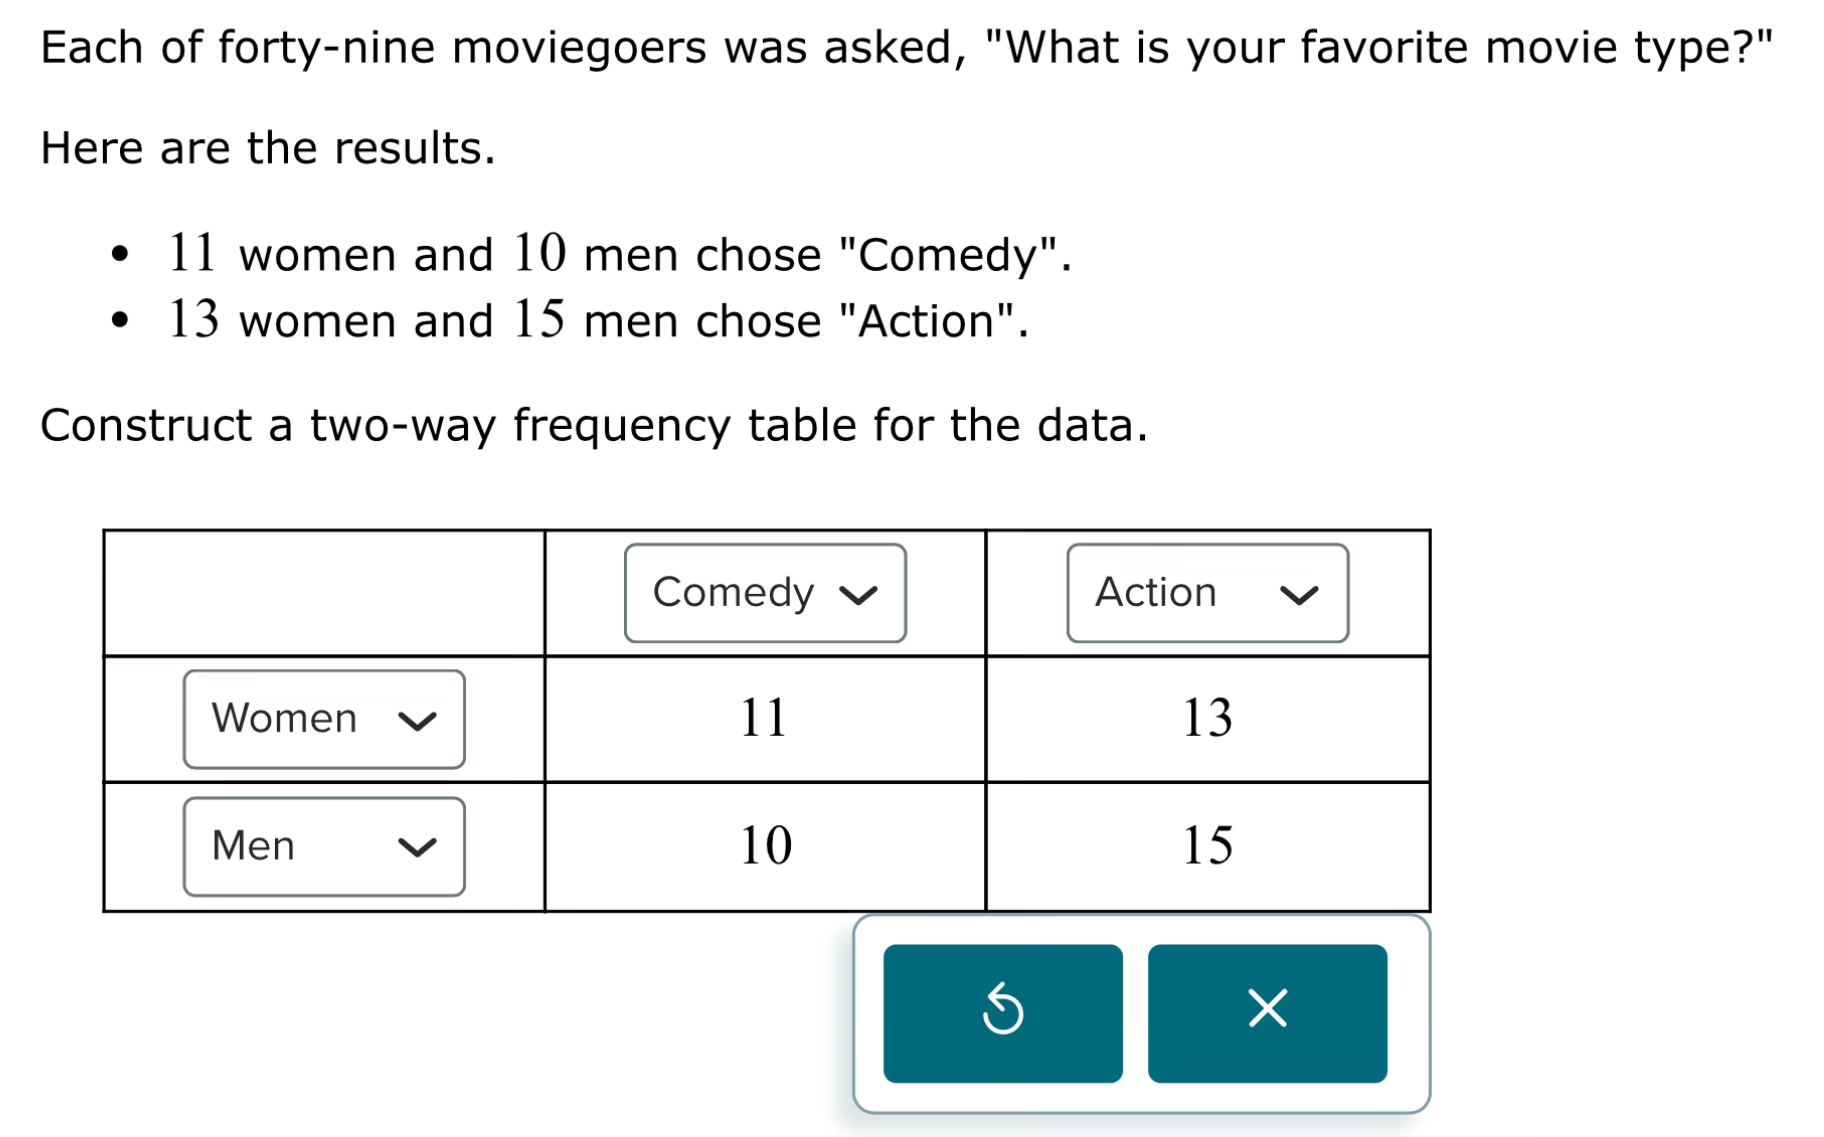
 Topic 11: Constructing a two-way frequency table: Advanced
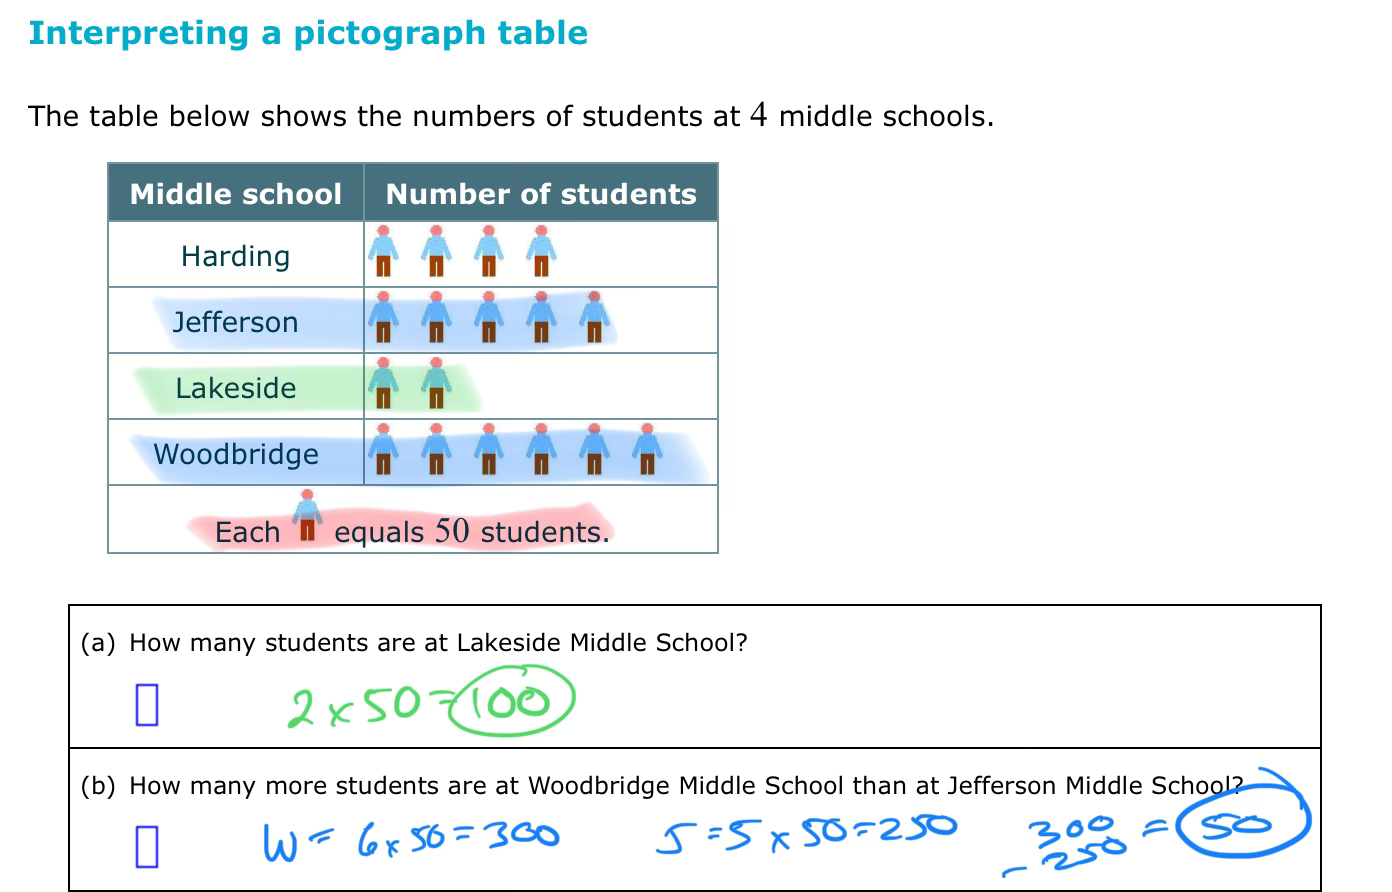
 Topic 12: Interpreting a pictograph table